California state income tax
One formula instead of ten brackets
California taxes personal income using graduated brackets. This exploratory policy model compares those brackets with a CPI-indexed smooth-rate formula and separately examines taxing borrowing against appreciated assets. Change the assumptions, examine who pays more, and see how much of an illustrative spending plan remains funded under revenue risk.
Not an official fiscal estimate. Revenue and distribution charts use a coarse proxy based on aggregated FTB 2022 income classes, not taxpayer-level modeling; policy design and constitutionality require further analysis. Updated November 20, 2026.
Rate on your next dollar today's 10 brackets and the proposed formula
Stress-test the revenue estimate illustrative assumptions, not predictions
Single-filer marginal rates on a logarithmic taxable-income axis. Existing-tax calculations use the FTB 2026 schedules, with the additional 1% tax above $1 million. Neither revenue projection nor class-average incidence estimate uses individual returns. The borrowing provision is excluded from every statewide revenue estimate.
Illustrative class-average tax changes aggregated FTB income classes; not precise taxpayer counts
Hover over or tap a bar for details.
In the “by number of returns” view, bar width corresponds to the number of returns in each FTB 2022 adjusted-gross-income class. In the “by income” view, bars use a logarithmic income scale. Height uses a signed logarithmic transform. These are proxy class averages: adjusted gross income is not taxable income, some joint-filing shares are assumed, and income varies within each class. Counts described as paying more or less are model classifications of class averages, not measured taxpayer-level results. The chart is static and does not reflect the separate behavioral and market sliders.
The formula
rate on next dollar = 38.5% × income ÷ (income + $450,000)
Total tax works out to top rate × (income − halfway × ln(1 + income ÷ halfway)), so the Franchise Tax Board can still print a lookup table for people who file on paper.
Two numbers determine the schedule. Existing progressive brackets already avoid a jump in total tax when income crosses a threshold; they have jumps in the marginal rate. This proposal replaces those marginal-rate jumps with a continuous curve. Low incomes have low modeled rates before credits, and the rate gradually approaches the top-rate parameter at high incomes.
Keeping up with prices
Today the state adjusts each bracket every year for inflation, using the California Consumer Price Index from June to June. With the formula, the state adjusts only one number: the halfway income.
halfway income this year = $450,000 × (CCPI this June ÷ CCPI June 2026)
Because the formula only uses income divided by the halfway income, moving that one number shifts the whole ramp at once. If prices rise 3%, the halfway income becomes $463,500, and someone whose pay also rose 3% pays the same share as before. The top rate never changes unless lawmakers or voters change it. A state could instead tie the halfway income to median wages, so that real raises do not slowly push people up the ramp.
An illustrative funding ledger billions per year; depends on user-selected assumptions
The left shows proxy gross additional taxes after illustrative offsets, compared with modeled tax reductions. The right applies the resulting proceeds to an illustrative spending list. This is not a forecast or a binding appropriation.
Show assumptions and revenue calculation
The model uses public Franchise Tax Board tax-year 2022 aggregate adjusted-gross-income classes. For each class it treats the class-average adjusted gross income as if it were taxable income, assumes a joint-filer share rising from 20% in lower classes to 75% in higher classes, and computes the ratio of proposed tax to 2026 tax on those representative amounts. It applies the ratio to reported class tax liabilities; the combined percentage change is applied to an assumed $149.6 billion annual statewide personal income tax baseline. These methods cannot reproduce the actual distribution of filing status, exemptions, credits, deductions, or within-class income. The top category begins at $10 million in adjusted gross income.
Gross modeled tax increases and gross tax reductions are estimated separately. Behavioral and market sliders reduce the former multiplicatively but do not reduce tax cuts. The default offsets are zero, and selecting a stress case supplies hypothetical parameters, not research-based behavioral elasticities or a direct translation of an LAO market forecast.
Borrowed gains generate no additional modeled statewide revenue. The $49.5 billion annual spending list is an illustrative collection of goals, including a $12 billion placeholder for education-related obligations; Proposition 98, Proposition 2, program costs, and spending authority require separate scoring. Source: FTB aggregate income-class comparison; LAO 2027–28 fiscal outlook.
What it pays for
The spending figures below are the proposal's illustrative policy targets, not new official appropriations or current LAO cost estimates. In its November 18, 2026 fiscal outlook, the LAO projects a roughly $2 billion budget problem in 2027–28 and larger deficits afterward, with substantial stock-market risk. Existing constitutional requirements, including Propositions 98 and 2, affect the allocation and availability of new revenue.
- Close the deficit: about $10 billion a year
- Keep CalFresh whole: about $4 billion a year
- Restore Medi-Cal coverage and clinic payments: about $4 billion a year
- Build 90,000 more affordable homes a year: about $15 billion a year
- Make public college debt-free: about $4.5 billion a year
- Possible additional education guarantee and related requirements: placeholder of $12 billion a year; not an official Proposition 98 calculation
- Total: about $49.5 billion a year
Separate, long-run housing scenario: If funding, construction capacity, land use, infrastructure, and permitting enabled 90,000 additional completed homes a year for ten years, the illustrative supply scenario is 900,000 additional homes. A roughly 3% rent reduction relative to an otherwise-identical market is a modeling assumption, not an immediate household tax saving or a guaranteed result.
Debt-free college would pay what resident undergraduates at community colleges, Cal State, and the University of California still owe for tuition and living costs after federal grants, a family contribution, and part-time work. The Legislative Analyst estimated this at $3.3 billion a year in 2017, about $4.5 billion in today's dollars, with about two-thirds going to community college students. Students could finish a degree without loans. Like the housing money, it would sit in its own fund.
At zero offsets the revenue result is a static extrapolation of 2022 FTB class data, scaled to the assumed statewide PIT baseline. It excludes taxes on borrowing against gains. The spending ledger is illustrative, and any Proposition 98/2 mandates need independent fiscal scoring; borrowing revenue must not be presumed to be positive or immediately available.
Gains you borrow against
One separately modeled option is to treat certain borrowing against appreciated assets as a deemed realization of gains. This is not current California law. It would need clear valuation, basis, refinancing, pass-through-entity, residency, and repayment rules, as well as legal analysis under 2026 Proposition 42. A potential design to evaluate:
- For otherwise eligible borrowing, include only the amount above the annual exemption, capped by unrealized appreciation not previously taxed on the relevant pledged assets.
- The first $250,000 a year per person is free (indexed like the halfway income), so ordinary borrowing is not affected.
- Exempt ordinary primary-home mortgages, education and auto loans, and standard unsecured credit cards; carefully define exceptions to avoid creating loopholes through real estate or entity structures.
- Increase the assets' tax basis by the amount treated as realized, to avoid double taxing the same gain at sale; loan repayment and refinancing treatment still requires drafting.
- The counted amount goes through the same formula as any other income.
Related federal approaches are discussed by the Yale Budget Lab; the specific California exemption and formula here are the proposal's own assumptions. California Proposition 42 (approved November 2026) restricts new taxes on owning personal property; the legal status of a deemed-realization rule on borrowing needs independent assessment. The model assigns this module zero statewide revenue.
Individual tax calculator 2026 baseline, before deductions and credits not already reflected in taxable income
Enter taxable income and optional loan and unrealized-gain amounts.
The proposed head-of-household schedule is not yet specified in legislation; this calculator provisionally uses 1.5 times the halfway-income parameter. Current-law taxes include the 1% Behavioral Health Services Tax above $1 million in taxable income. This simplified model excludes credits, AMT, and most special tax rules. Borrowing estimates do not change the statewide revenue chart.
Illustrative household budgets income-tax changes only; no speculative rent discount
Each card uses stated California taxable income (not salary or gross income) and 2026 existing-law bracket rates. Rent and home-price effects from housing policy belong to a separate, conditional long-term scenario above.
Why this matters
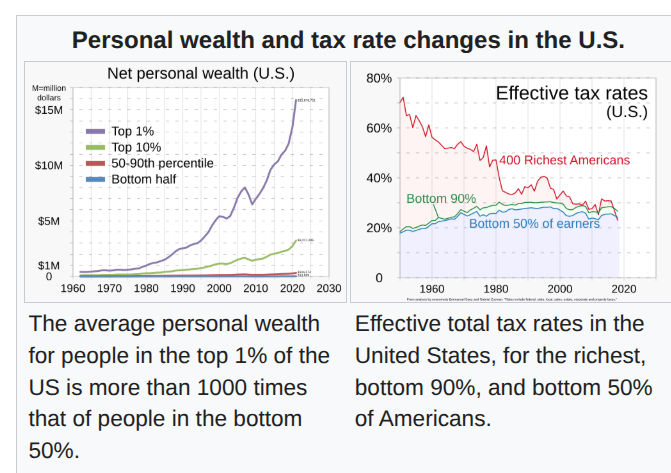
The U.S. historical figures above are context, not evidence about present-day California tax incidence. For this proposal, the central questions are California's existing state-income-tax distribution, the difference between earned income and realized gains, and whether a new levy yields durable revenue after behavioral changes. The class-average chart and source links offer a starting point, not a resolution.
What critics say
Critics emphasize the increased marginal burden on high-earning employees, possible migration or timing responses, difficulty of taxing loans instead of realized gains, and the state's already volatile income-tax collections. Others emphasize high levels of unrealized asset appreciation that ordinary W-2 withholding never reaches. The 38.5% state formula rate is a high-income asymptote, not the rate applied to all income; combined state and federal marginal rates can nonetheless be high and depend on deductions, federal treatment, and income type. California's 2026 Proposition 3 made existing upper-income provisions permanent, Proposition 42 limited certain new taxes on personal property, and Proposition 2 changed reserve rules. These require legislative and constitutional review before a proposal can be scored or enacted.
Sources: FTB on indexing, Yale Budget Lab on borrowing against gains, FTB 2026 brackets, LAO November 2026 outlook, LAO on H.R. 1 CalFresh changes, FTB income distribution data, LAO on housing costs, California Housing Partnership 2026, Enterprise pipeline brief, LAO on debt-free college, LAO ballot proposition descriptions.
Draft a letter for official fiscal analysis
The preview below uses the top-rate and halfway-income sliders, plus the behavioral and market assumptions you have selected. It requests review rather than representing an independently scored legislative package. Replace the highlighted fields before sending.
Find your legislators at California's official legislator lookup; verify contact details and committee membership before sending.
Subject
Request for analysis of a smooth California income-tax schedule and deemed-gain borrowing rule
[Your full name]
[Street address]
[City, CA ZIP]
[Email]
[Date]
Dear [Assemblymember / Senator / legislative staff],
I am a constituent interested in an independent fiscal and legal analysis of replacing California's graduated income-tax brackets with a smooth formula, with a separate option for recognizing some unrealized gains when appreciated assets are used to secure personal borrowing.
The current scenario specifies a marginal state tax rate of 38.5% × taxable income ÷ (taxable income + $450,000), with the halfway-income parameter indexed annually to inflation. For joint filers it would be doubled; head-of-household treatment needs further definition.
The site's aggregate-class static proxy estimates a change of $0B in annual personal income tax revenue before behavioral responses. Assuming a 0% offset to gross added tax and a separate 0% market-related offset, the displayed illustrative net change is $0B. These are not FTB or LAO estimates; the analysis uses 2022 aggregate income classes, not individual tax records.
I ask the FTB and LAO to estimate distributional effects by actual taxable income and filing status, the exposure of upper-income wage earners and capital gains, migration and reporting responses, spending constraints under Propositions 98 and 2, and alternative assumptions during market downturns. Please assess the constitutionality and administrative feasibility of a carefully specified deemed-realization rule in light of Proposition 42, including exemptions, basis adjustments, refinancing, and anti-avoidance rules. Revenue from that separate module should not be counted before independent scoring.
The illustrative spending goals include fiscal stabilization, food assistance, health coverage, affordable housing, and college affordability; their amounts and spending authority should be separately verified before commitments are made.
For reference, the interactive scenario is at https://taxproposal-tentative3.pages.dev/.
Thank you for considering a public hearing and an independent assessment of the tradeoffs.
Respectfully,
[Your name]
[Assembly / Senate district]